Last week, my colleague Dacia and I were fortunate enough to go out to Avalon to meet Ken Gledhill and Kevin Fenaughty, two of the people involved in GeoNet.
The website will be one familiar to many Kiwis - a GNS initiative, it is the public face of a project which aims to collect data for all the various natural hazards which can, and do, occur in New Zealand: from earthquakes to tsunamis to volcanoes and more besides.
Like many people, I’m familiar with the homepage, which looks at earthquakes occurring on the islands. With some 13,000 quakes of over magnitude 3 happening every year in New Zealand , it’s not surprising we’re all so very interested in them. What impressed, me, however, was how much more there is packed into the site. Some of it’s, well, not buried per se, but not necessarily intuitively reachable either unless one’s spent some time trawling through everything.
Dacia and I were lucky enough to be taken through the site itself by Kevin Fenaughty, who knows it very well, and was also very patient in answering our ‘oooh, what is that?’ questions. While I found it all fascinating - and here I must confess I’ve never been much of a geology person - I think my favourite discovery was the imagery made by the RSAM/SSAM drums.
These drums are used in the measurement of volcano activity, but are incredibly sensitive. So sensitive that, looking at the SSAM drums, they are able to pick up wind, or people’s footsteps. A great example of this can be seen below. It shows what’s called diurnal activity - the daily rhythms of the surrounding area.
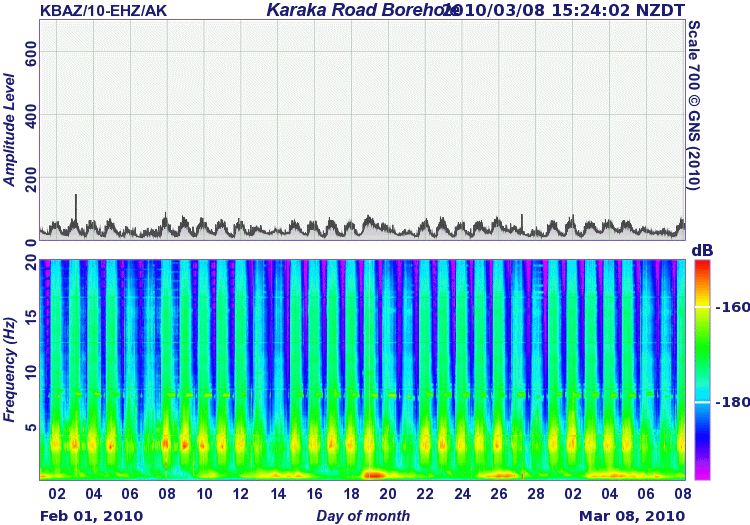
With this sort of activity, you see higher spikes during the week than the weekend, due to the ebb in traffic (car and pedestrian) then - it’s clearly visible on the SSAM plot above. Apparently, what one looks for isn’t just the spikes, but what exactly is going on in them, and you don’t just look at one type of measurement - you combine SSAM and RSAM. So, for example, in the SSAM graphs, you look for areas where there is orange (near the midline). You then combine that with the RSAM measurements to look for a specific pattern - if you have both, then you have volcanic activity (examples on Fig. 12 and 14).
In fact, the above link points to part of a fantastic page explaining all of the seismic methods used to measure volcanic activity, and how to correctly interpret seismograms (hopefully a page like this for earthquakes is also in the making).
The tsunami gauge network charts are also really interesting. Again, I’ve reproduced one with permission from GNS.
(Click on image to enlarge)
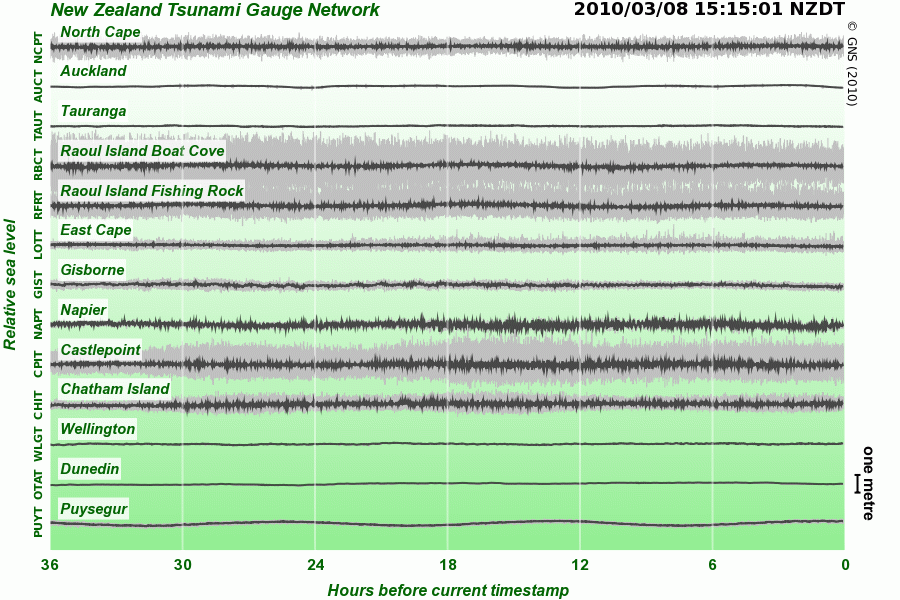
So, what does this chart mean? Well, it shows the readings of a number of different sensors, placed both in open water and harbours. The squiggly (or not, as the case may be) dark grey line shows the waves themselves, and is an average. The light grey line shows the difference in wave heights, which is why the open water sensors have a far higher incidence of grey lines than the harbours. You can also have the chart displayed with the tides put back in, which makes everything look like some kind of optical illusion, and definitely made my eyeballs feel a little odd. Of course, it’s also a very clear means of seeing the time lag between tides - high and low don’t happen at the same time everywhere, of course!
There’s a tonne of other stuff too, if you’re willing to dig in a layer or two. For example, the front page for the ‘landslides’ section isn’t terribly gripping, but it’s worth persevering into the section in order to look at things such the Taihape landslide - a slow-moving one which has been going for, well, quite some time. And click on the poster link for the Young River landslide as well - it looks to have been quite something!
The other sections (earthquakes, news, and resources) are of course also fantastic - it’s just there’s only so much text a person can put down in a blog post… And they are probably two of the more familiar sections to people anyway.
And finally, did I mention the datasets? Because people who’re interested in such things can actually download entire datasets as well, to do with as they wish. Which, I can imagine, could be quite a lot of fun if you’re that way inclined.
So I will leave you there, dear readers, with a gleeful encouraging to go, have a look, and play. The site’s foci may be hazardous, but the site itself couldn’t be less so.
And kudos, as well, to all the people involved in the greater GeoNet!