Uptime monitoring service Pingdom’s released its ‘internet 2011 in numbers’, and the numbers are, to say the least, pretty interesting!

I’ve pulled out a few of my favourites below:
Websites
The number of websites out there more than doubled in 2011. From 255 million in 2010 to 555 million in 2011.
One wonders how many of those are Ryan Gosling ‘Hey Girl’ meme websites :P
Emails
There are 3.146 billion email accounts out there, it would seem. Also, corporate users were sending and receiving 112 emails a day.
And as for spam? Some 71% of worldwide email traffic apparently falls into this category.
[Thanks goodness for the excellent spam filter in my email accounts!]
Internet users
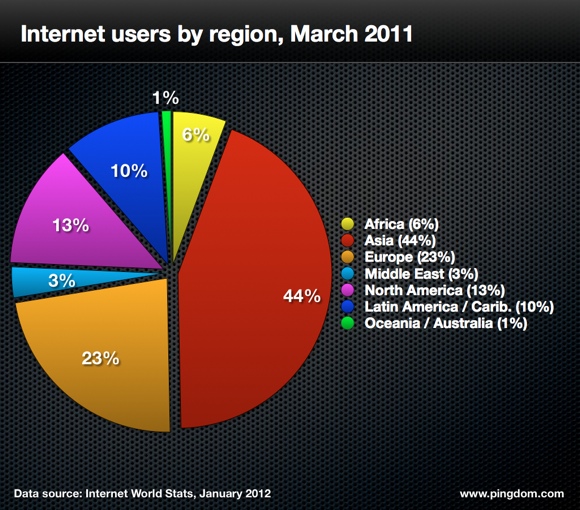
We now have 2.1 billion internet users worldwide (yay!), of which 922.2 million are in Asia.
China has 485 million internet users alone – more than any other country on Earth. Oceania/Australia, in comparison, has only 21.3 million users.
Since NZ’s internet penetration is 83.1% (one of the highest in the world!), that means we account for, um, 3,668,366 of those.
And the net’s denizens are a pretty young bunch – 45% of users are under the age of 25 :)
Social media
Some fascinating stuff here!
Of the 800+ million users on Facebook by the end of 2011, 200 million had joined in that year.
There are also 225 million Twitter accounts, and 100 million active Twitter users. Also, Lady Gaga is Twitter’s most favouritest person, with 18.1 million followers!
#egypt was 2011′s number one hashtag (awesome).
And $50,000 was raised for charity by the most retweeted tweet of 2011, by @Wendys: “RT for a good cause. Each retweet sends 50¢ to help kids in foster care. #TreatItFwd”
There were 39 million Tumblr blogs by the end of the year, and 70 million WordPress blogs (happy to be contibuting to those numbers!).
Oh yeah, and there were 2.4 billion social networking accounts worldwide. I’d certainly love to know what the breakdown was, after Twitter and Google :)
Domain names
At the end of 2011, there were 95.5 million .com domain names. I’m afraid they didn’t show stats for .nz domains – anyone have those? UPDATE: Thanks to @IanTLS for pointing me to the right page on the .nz domain name commission, which says there were 466,192 .nz domain names registered at 31 Dec 2011 :) I’m responsible for, um, two (well, three technically) of those. Yay!
Also, by Q3 of 2011, there were 220 million registered domain names, and 324 top-level domains!
And a fun little figure: the most expensive domain name sold in 2011 – social.com – went for $2.6 million. An awful lot less than I pay for my domain names, I can freely vouchsafe :P
Web browsers
IE has the largest market share of web browsers, at 39%. Urg.
Google’s Chrome has 28%, followed by Mozilla Firefox at 25%.
Safari has 6% :P
Mobile
There were an estimated 5.9 billion mobile subscriptions worldwide in 2011, and 1.2 billion active mobile broadband subscriptions worldwide.
85% of mobile phones (‘handsets’) shipped worldwide included a web browser :)
Videos
There were 1 trillion video playbacks on Youtube. That’s 140 video playbacks per person on Earth…
48 hours of video were uploaded to YouTube every minute.
In the ‘please god let the aliens nuke us from orbit’ bucket, the most-viewed video on YouTube, during 2001 was Rebecka Black’s ‘Friday’. And no,
I’m not going to link to it. Ew. It’d get my site all sticky…
Over 4 million users signed up to Vimeo.
And, at least as of October 2011, 201.4 billion videoes were viewed online per month. It appears we like to watch things :)
Images
14 million Instagram accounts were created in 2011, with on 60 photos (on average) being uploaded per second.
There were an estimated 100 billion photos on Facebook by mid-2011.
Flickr had 51 million registered users, hosting 6 billion photos (Aug 2011) and seeing 4.5 millions photos uploaded to its service every day.
And the most popular camera on Flickr? The Apple iPhone 4 :)
Web servers
Apache websites saw the largest growth in numbers, at 239.1%. Google websites saw a growth of 80.9%, and IIS and NGINX websites saw, well, less than that at 68.7% and 34.4%, respectively.
—–
Awesome stuff! You can see even _more_ numbers (and their sources) on the Pingdom website, and you can also look at their numbers for 2008, 2009 and 2010.
Happy analysis!