Part I: The basics
Today, StatisticsNZ released a, well, release on bioscience in NZ. Who’s doing it, where, what it’s costing them and what they’re making of of it. And, of course, what they’re actually doing.
To explain, then: the bioscience survey replaces its predecessor, the biotech survey. Apparently, it was to enable the survey to track a wider, and therefore more representative, section of technologies. It then goes on say:
The information gathered is intended to measure the contribution of bioscience to the New Zealand economy and to assist in the formation of policies and procedures in support of bioscience business activity. The survey measures the use of biosciences and their uptake by organisations. The survey also asked respondents about the characteristics of their organisations, including the use of strategic alliances, information sharing, and constraints on bioscience work.
To specify further, bioscience activities occur in the following areas (list taken from the release):
- agriculture feedstock and chemicals
- aquaculture, horticulture, and forestry
- human and animal therapeutics and diagnostics (including clinical trial providers)
- medical devices and equipment
- research testing and medical laboratories
- microbes
Now that we feel appropriately girded, let us have a look at some of the data that came out of the survey.
First, it differentiates between three different types of organisations involved in bioscience:
- Core - Organisations where bioscience is what they do (i.e. they make bioscience goods and products)
- Active - These organisations are involved in as far as they use bioscience processes to make stuff (products) but actually operate in fields other than bioscience
- Research group - This would appear to be self-explanatory. They can include CRIs, universities, and other types of research organisation.
-
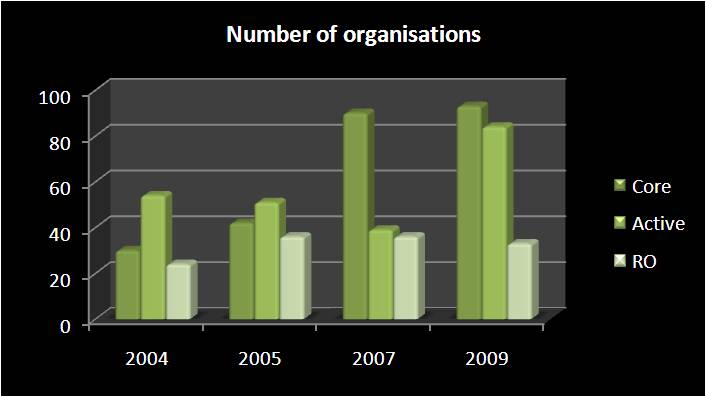
Source: StatsNZ BioScience Survey 2009
Please note: - part of the spike in number since 2008 is due to the increased scope of the survey
Of these, you’ll notice that Active organisations are no longer the majority - they’ve been taken over by Core organisations. This can only be a good thing, of course, as it shows that bioscience is becoming an increasingly important part of our economy, and that we’re sufficiently good at it to be supporting a growing number of businesses therein.
Of course, within these are a number of different types of industries.
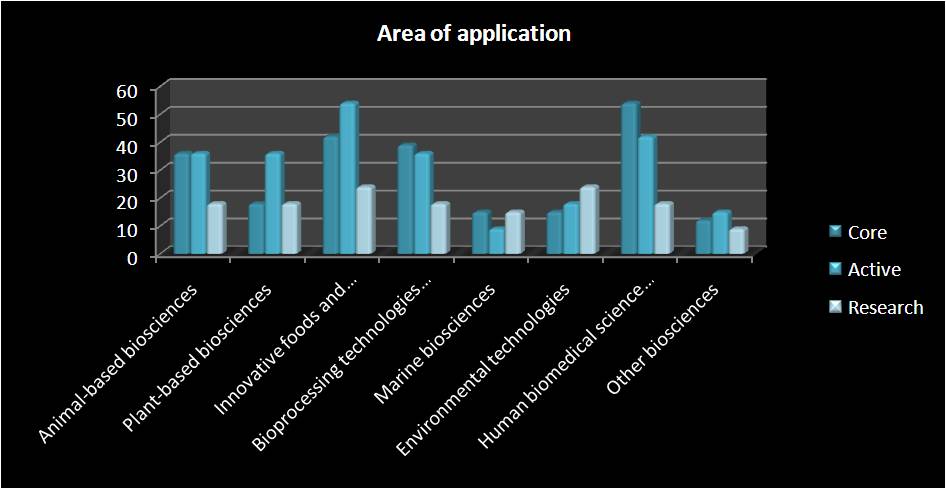
As you can no doubt see, two of the largest areas in which organisations are involved are in the innovative foods and human biomedical sciences. This makes sense, I guess - after all, we’ve got to eat, and we do tend to get sick! If you’d like to see a little more detail, I’ve also included a graph at the bottom of this post.
(I should also point out, where you see those ellipses on the x axis, that they complete as follows: ‘Innovative foods and human nutrition’, ‘Bioprocessing technologies and biomanufacturing’ and ‘Human biomedical science and drug discovery’.)
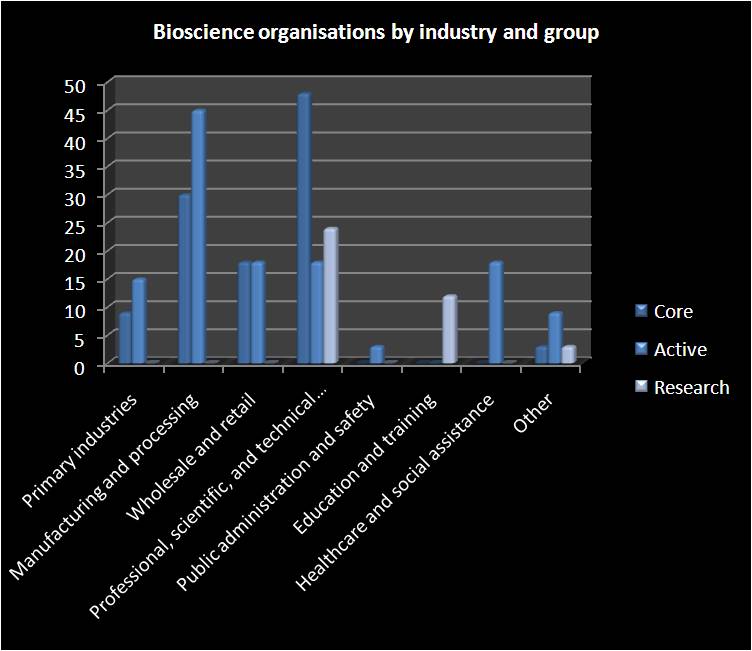
As you can see, those industries who work in the ‘Professional, scientific and technical services’ industry form the vast majority of the organisations involved in bioscience, across all three categories. Active organisations are also very involved in manufacturing and processing - not perhaps surprising given the fact that one of the major areas of expertise is in the ‘innovative foods and human nutrition’ field.
And how much money does this generate for us? Well, the graph below shows only the financial data for the Core organisations - this makes sense, as it would probably be a bit tricky (and, possible, confidential) to split out bioscience-related activities in the other two types.
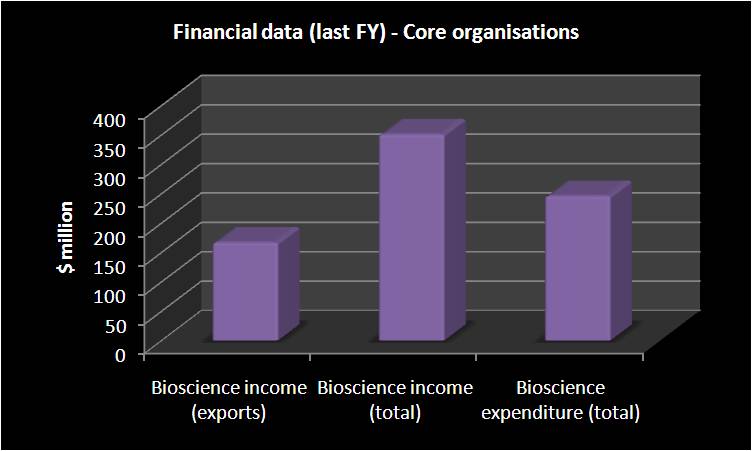
Encouragingly (as always), it’s good to see that income outstrips expenditure. And knowing that bioscience-based export alone brought in almost $150 million in the last financial year is, I think, quite exciting. After all, it’s a growth industry, so this can only be a good thing for us!
Finally, below is the graph showing the fuller breakdown of the different areas in which bioscience organisations are playing (apologies for the image quality - WP isn’t very happy with tables, though).
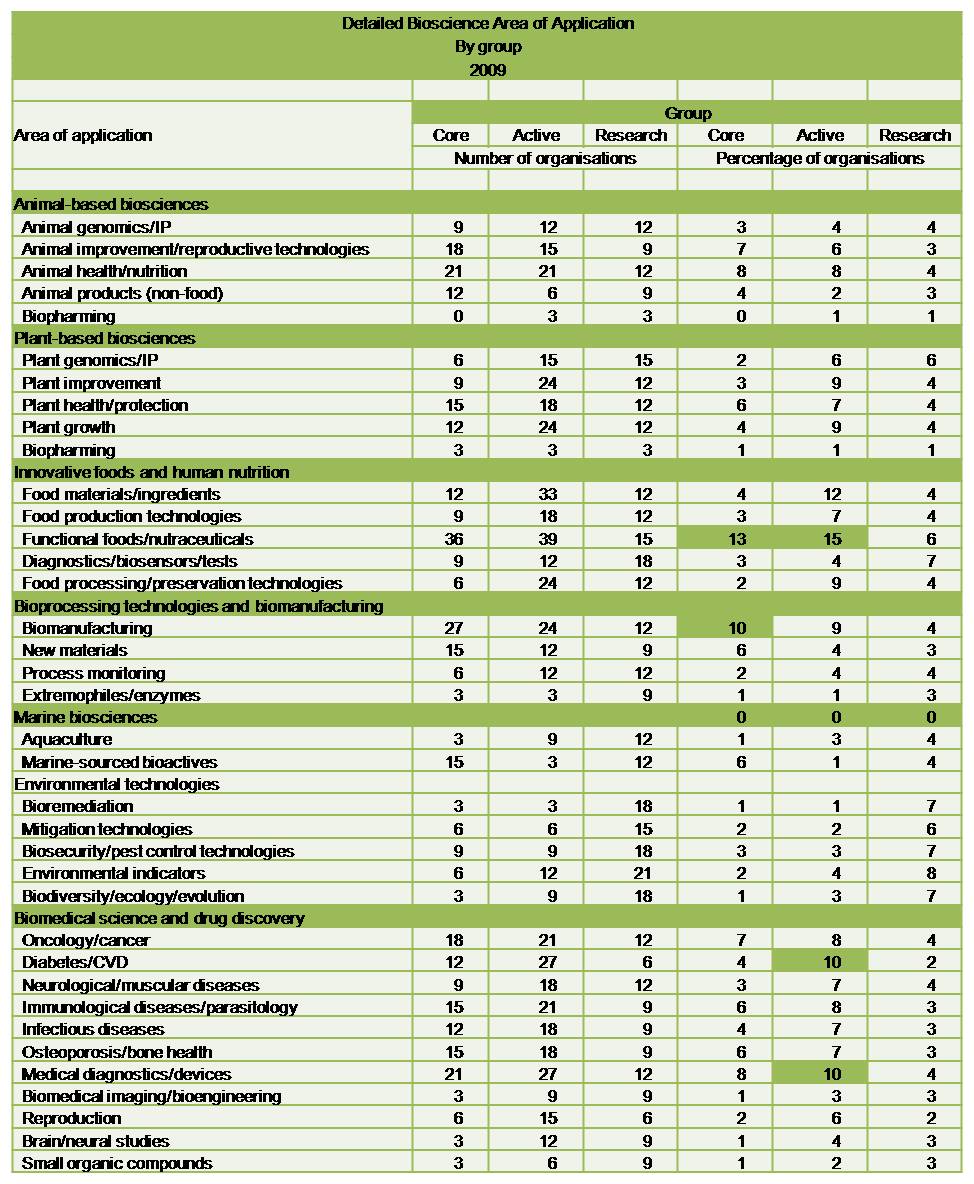
I’ve highlighted, in terms of %, any areas in which 10% of over of organisations are involved. These included the functional foods/pharmaceuticals (supplements and so forth), biomanufacturing, diabetes and CVD (while I can’t be sure, I wonder whether LCT is part of this?) and medical diagnostics and devices (for more of which, watch out for my upcoming series on high temperature superconductors).
In the next post, I’ll look into the where these organisations are in the development stages of bioscience, the benefits it brings, and the constraints faced by those who work in it. Didn’t want to overwhelm anyone!
Reference:
Pingback: BioScience in NZ: some statsy goodness Pt I | misc.ience | Drakz Free Online Service()
Pingback: BioScience in NZ: some statsy goodness Pt I | misc.ience | Drakz Free Online Service()
Pingback: BioScience in NZ: some statsy goodness Pt II | misc.ience()