Part II: How far along they are, how they’re battling and how we’re benefiting
Having set out the basics of the bioscience industry - who’s doing what, in essence - I though it would be interesting to see how the organisations involved are doing.
So, first up, let’s have a look at how far into the development stages of each type of tech the bioscience industry as a whole has got.
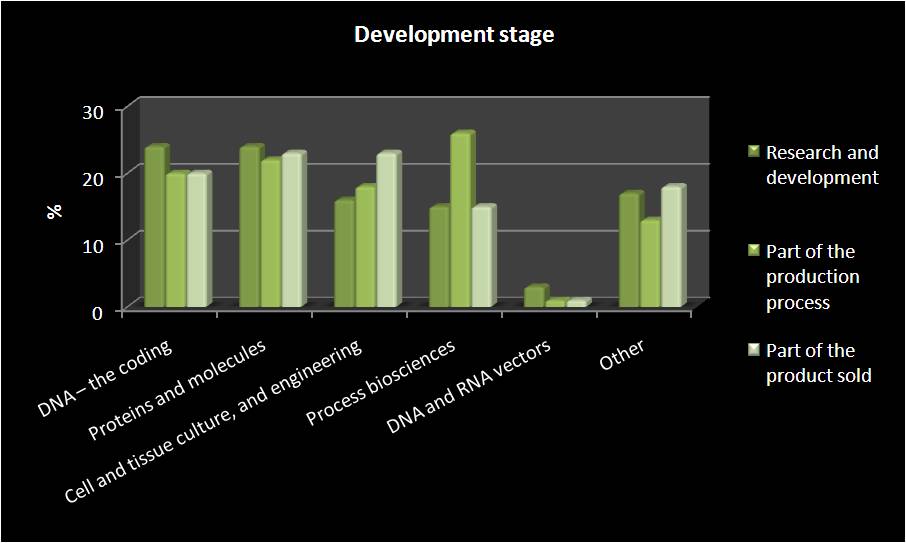
Interestingly, whereas DNA coding and ‘proteins molecules’ have organisations involved throughout the development process, cell/tissue engineering sees more organisations having it as patr of an already-developed product that they’re selling (or that makes up part of a product sold), and of course process biosciences tends to be primarily part of the production process.
Next, we’ll have a look at some news that seems to have particularly enthused those covering it in the media: how quickly the various types of organisations intend to have a new product developed and ready.
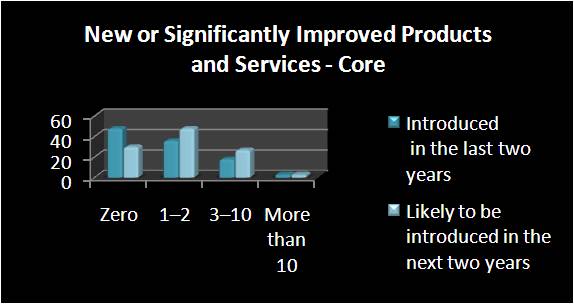
Of the Core organisations (of which there are 108), 57 (53%) introduced a new or significantly improved bioscience products and services in the last 2 years, and 78 (72%) intend to do so again in the next 2 years. Gosh. Possibly in line with the development of the industry as a whole, (and the ever shortening innovation cycles allowed companies) more companies are expecting to introduce new products/services than have in the past.
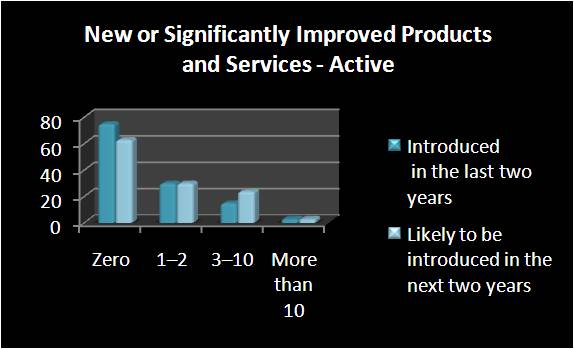
Amongst the Active organisations, of which there are 123 in total, 28 (39%) have introduced a new or significantly improved bioscience product within the last two years, whereas 57 (46%) intend to do so within the next two years. While speculation is, of course, generally a silly thing to do when it comes to stats (that’s why humanity uses qual as well as quant),this may reflect the fact that as the technology available improves (and, possible, gets cheaper), it may be integrated into more business processes.
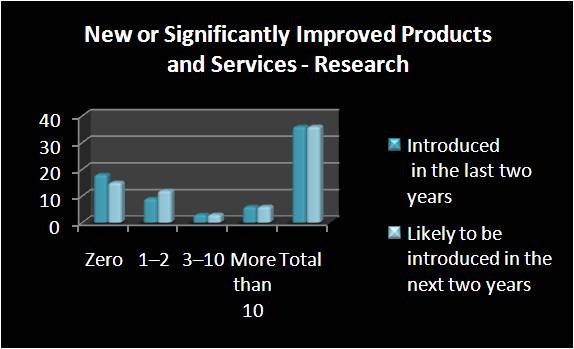
Finally, amongst Research organisations, the difference is the smallest. Of the 36 total, the split (as above) is 18 (50%) to 21 (58%). This may reflect the lessened commercial pressures exerted on research organisations (and, possibly, less R&D money as well).
To look a little more closely into what might be getting in the way of life for our bioscience organisations, let’s have a look at the three graphs below:
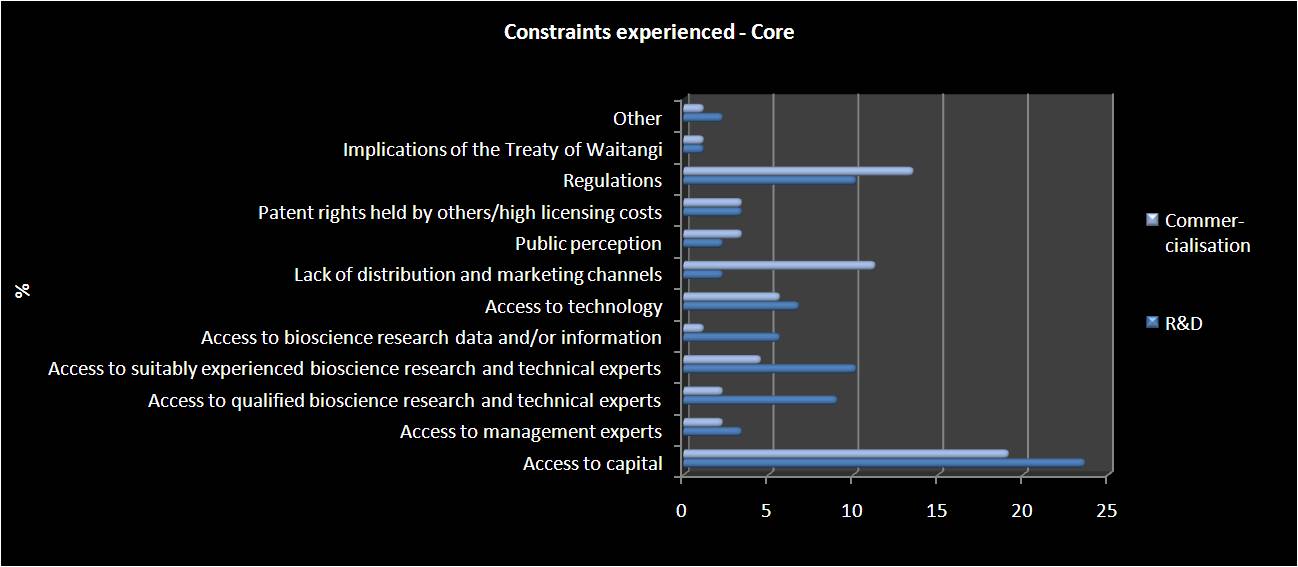
For Core organisations (and, indeed, for all three) access to capital is by far the most difficult constraint. Then again, I’d argue that for just about any industry and organisation, capital is going to be a major issue, particularly in industries where expensive innovation/R&D is required. Amongst Core organisations specifically, however, it would appear that regulations also form somewhat of a thorn in the proverbial and, for commercialisation at least, so does a lack of marketing and distribution channels. Access is also an issue for these organisations, especially in the R&D phase.
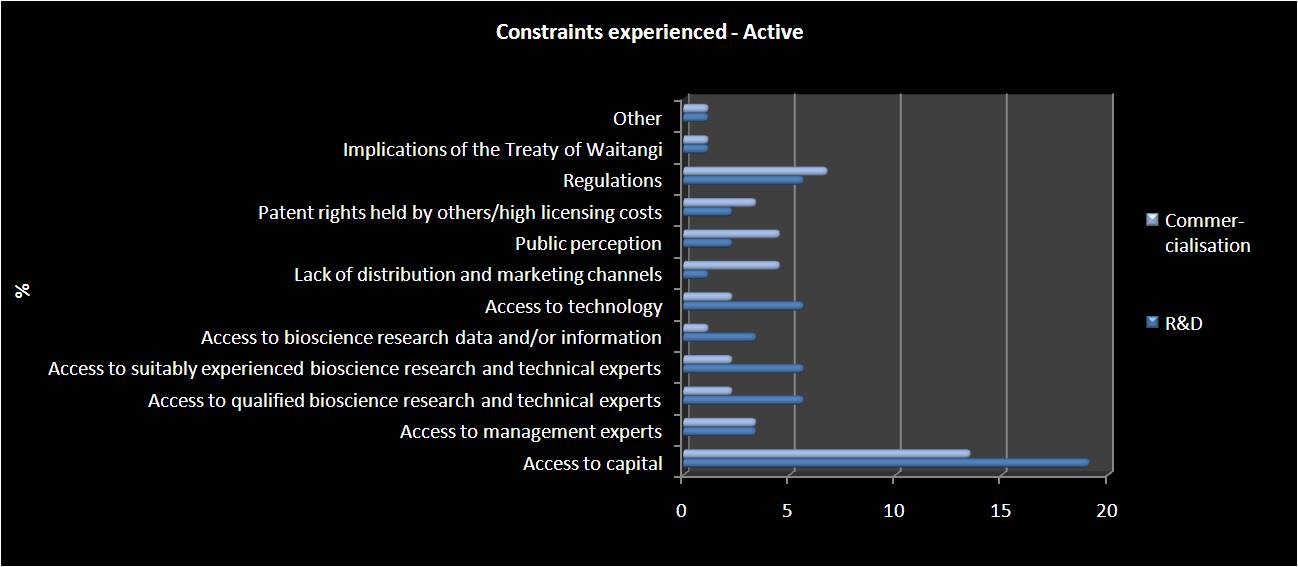
Amongst Active organisations, regulations are again a constraint (as is capital), but interestingly, most of the constraints listed are more important in the R&D phase than in the commercialisation phase.
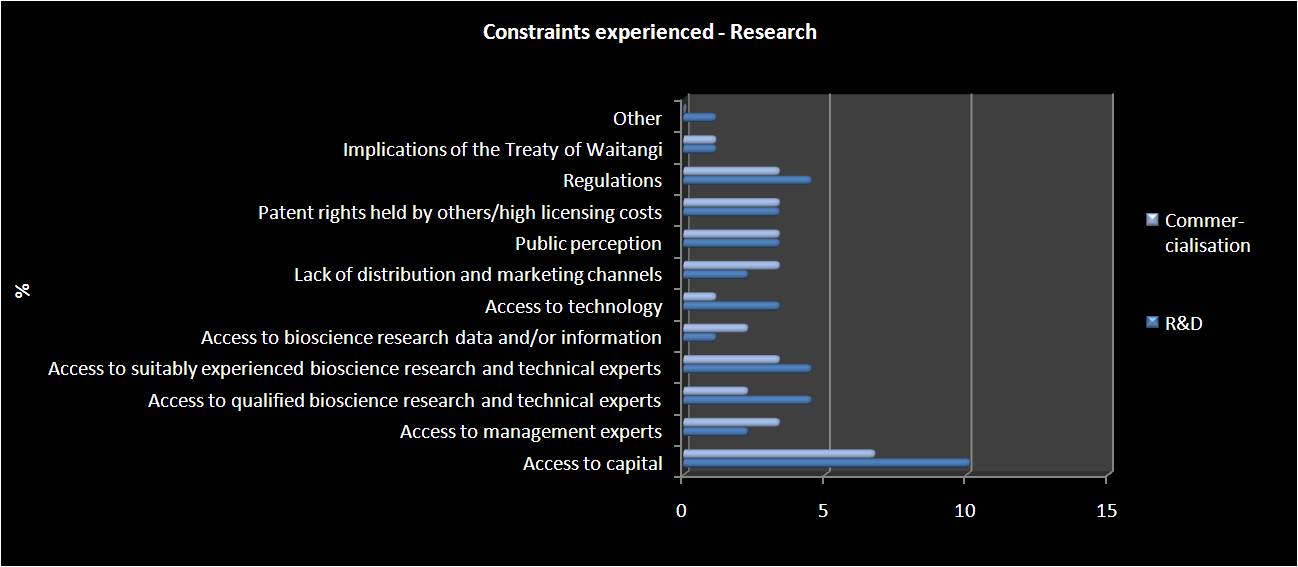
Finally, Research organisations show a slightly different pattern - for them, regulations are no more of an issue than patents and public perception! However, like the other two types, they also find access a problem, particularly for the R&D stages of a product/service/project.
And what are we getting out of this industry, despite the constraints of it all?
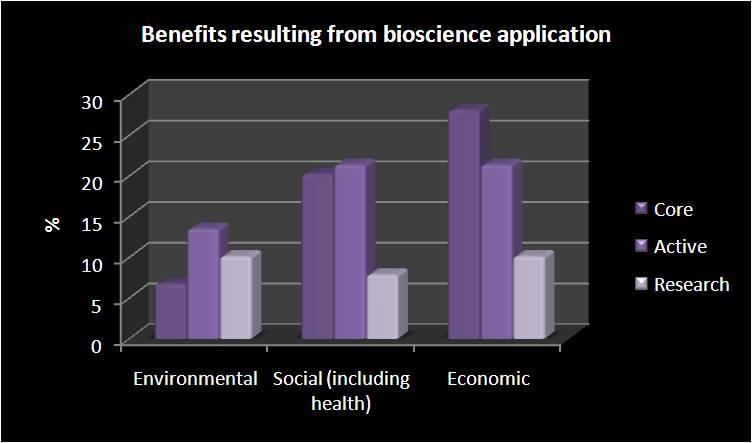
We’re getting economic, social and environmental benefits. Hooray! And the largest gains to be had are economic - given NZ’s focus on trying to up our DGP and living standards, this can’t be a bad thing (see the previous post to get a look at some of the money that’s being generated). In terms of social and economic benefits, the Core organisations are of course the most significant contributors. Interestingly, Active organisations are the largest contributors to the environmental benefits.
So, dear readers, there you have it. This is only a soupcon, mind you, of the full amount of data released. There’s oodles more, including a breakdown of the local and international alliances which have formed, the IP landscape of the bioscience sector, and even a breakdown of activity by region in New Zealand. Feel free to peruse*(there’s a written release, and you can also have fun with the data itself, as I have).
References:
* StatsNZ BioScience Survey 2009